What is the carbon cycle? A carbon atom's journey from the air to the sea
A carbon atom can stay a few years in a leaf, centuries in the ocean and millions of years in rock. We explain the fast and slow carbon cycles, the Mauna Loa measurements, where human CO₂ goes and why the ocean is acidifying, with a pH calculation.
In this article · 10 sections
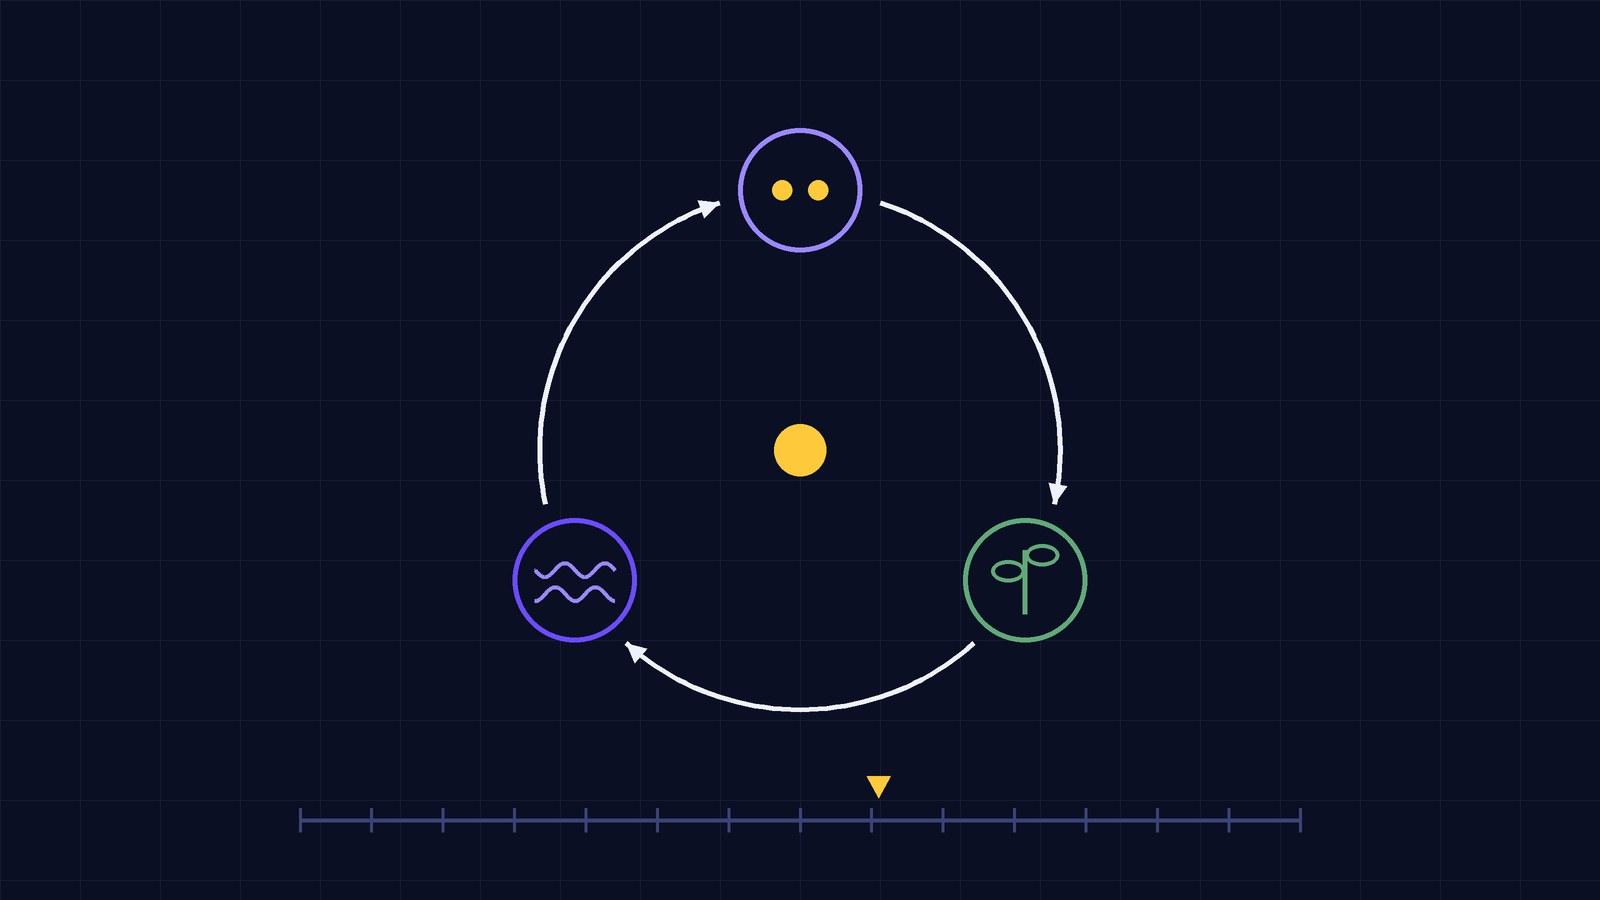
The theme of COP31’s 17 November is Ocean, Seas, Nature and Land Use (COP31 thematic days). The ocean, forests and soil are parts of the same cycle. This article is about that cycle, the journey of carbon around Earth, and the change it is causing in the chemistry of the ocean.
Imagine following a carbon dioxide molecule as it leaves a bus exhaust. The wind may carry it to a forest, where a leaf turns it into sugar by photosynthesis. Or it may reach the sea, dissolve in the water and end up in the shell of a sea creature. Perhaps millions of years later it will be found in a limestone rock. The carbon atom is not destroyed; it only changes place and form. All these journeys together are called the carbon cycle.
Where is the carbon?
As NASA’s Earth Observatory explains, most of Earth’s carbon, about 65,500 billion tonnes, is stored in rocks. The rest is in the ocean, the atmosphere, plants, soil and fossil fuels. Carbon moves between these stores at different speeds, so the cycle is split into two.
The fast cycle: a lifetime
The fast carbon cycle runs largely through living things. Two reactions drive it:
Photosynthesis (plants and marine plankton take carbon from the air or water):
Respiration and decay (living things burn sugar and give the carbon back):
According to NASA, 1,000 to 100,000 million tonnes of carbon move through the fast cycle every year. (Our articles What is photosynthesis? and How do you make compost? explain these two reactions in detail.)
The cycle is so strong that the seasons show up in measurements of CO₂ in the air. In the Northern Hemisphere winter, few plants are growing and many are decaying, so CO₂ rises. In spring, when plants start growing again, CO₂ falls. NASA describes this as “as if the Earth is breathing”.
Mauna Loa: the longest record of carbon in the air
According to NOAA’s Global Monitoring Laboratory, the record from the Mauna Loa Observatory in Hawaii is the longest record of direct measurements of CO₂ in the atmosphere. The measurements were started in March 1958 by C. David Keeling of the Scripps Institution of Oceanography; NOAA has made parallel measurements since 1974.
| Year | Mauna Loa annual mean CO₂ |
|---|---|
| 1959 | 315.98 ppm |
| 1985 | 346.35 ppm |
| 2000 | 369.71 ppm |
| 2015 | 401.01 ppm |
| 2025 | 427.35 ppm |
Source: NOAA GML, Mauna Loa annual means.
Calculation: the rise from 1959 to 2025 is ppm, or of the starting value. We can see the seasonal breathing in the same data: in 2025 the monthly mean was highest in May at 430.51 ppm and lowest in September at 424.37 ppm. The difference is about 6 ppm.
The slow cycle: rock time
According to NASA, in the slow cycle it takes carbon 100–200 million years to move between rocks, soil, ocean and atmosphere, and only 10–100 million tonnes of carbon pass this way each year. The journey goes like this:
- CO₂ in the air dissolves in rainwater to form a weak acid, carbonic acid.
- This acid slowly dissolves rocks (chemical weathering), releasing ions such as calcium and magnesium.
- Rivers carry these ions to the ocean. Calcium combines with carbonate in the water to form calcium carbonate, most of it made by shell-building organisms.
- The shells settle on the sea floor and over millions of years turn into limestone.
- Volcanoes return some of the carbon in rocks to the atmosphere.
According to NASA’s figures, volcanoes today emit 130–380 million tonnes of CO₂ a year, while people emit about 30 billion tonnes of CO₂ a year by burning fossil fuels, 100–300 times as much as volcanoes.
Where does human carbon go?
According to the IPCC Sixth Assessment Report, in 2010–2019 human activities released an average of 10.9 ± 0.9 PgC of carbon a year into the air as CO₂ (1 PgC is a billion tonnes of carbon). This carbon was shared out as follows:
- 46% built up in the atmosphere (5.1 PgC a year),
- 23% was taken up by the ocean (2.5 ± 0.6 PgC a year),
- 31% was stored by vegetation on land (3.4 ± 0.9 PgC a year).
Let’s check: ; ; . The percentages add up to . The IPCC’s summary also notes that over the past six decades land and ocean have taken up a near-constant share, about 56%, of human CO₂ emissions each year.
The ocean taking up this carbon slows the rise of CO₂ in the air, but it changes the chemistry of the sea. NOAA’s Pacific Marine Environmental Laboratory (PMEL) also notes that the ocean absorbs about a quarter of the CO₂ we release into the air each year. According to NASA, over thousands of years the ocean may absorb up to 85% of the extra carbon people have put into the air; but the process is slow, because it depends on surface water mixing into the depths.
Ocean acidification: the chemistry step by step
When CO₂ dissolves in seawater, a series of equilibrium reactions begins:
Some of the hydrogen ions (H⁺) released combine with carbonate ions (CO₃²⁻) in the water:
The result works in two directions: H⁺ in the water increases, so the pH falls; and carbonate ions decrease. Carbonate is a building block of calcium carbonate, from which mussels, oysters, corals and some plankton make their shells and skeletons. According to the IPCC, this process lowers the saturation state of calcium carbonate.
An important detail: the ocean is not acidic but slightly basic. “Acidification” means pH is shifting in the acid direction. In NASA’s words, a slightly alkaline ocean becomes a little less alkaline. (Our article What are acids and bases? explains the pH scale.)
Let’s calculate: is a pH drop of 0.1 small?
pH is defined by the logarithm of the hydrogen ion concentration:
According to NASA, the pH of the ocean surface has dropped by 0.1 units since 1750. Taking a pH that falls from 8.2 to 8.1 as an example, the ratio of the H⁺ concentrations is:
So a pH drop of 0.1 means the hydrogen ion concentration rises by about 26%. The phrase “about a 30% change in acidity”, common in many sources, describes a change of this size. A difference that looks small on a logarithmic scale is in fact a large ratio. (You can practise powers of 10 in our lesson Powers and exponential growth.)
According to the IPCC, surface ocean pH in subtropical regions has been falling by 0.016–0.020 units per decade since the 1980s, and acidification has spread below 2,000 m in the northern North Atlantic and the Southern Ocean. According to the report’s summary, open-ocean surface pH as low as in recent decades is unusual in the last 2 million years.
Common mix-ups
“If the ocean is acidifying, it is now acidic.” The ocean is still slightly basic. Acidification describes the direction in which pH is falling.
“A pH change of 0.1 doesn’t matter.” pH is logarithmic; a drop of 0.1 units is an increase of about 26% in hydrogen ion concentration.
“Volcanoes emit more CO₂ than people.” According to NASA’s figures, the CO₂ that people now emit from fossil fuels is 100–300 times what volcanoes emit.
“Plants and the ocean take up all the extra CO₂.” According to the IPCC, about 46% of human CO₂ in 2010–2019 stayed in the atmosphere.
Try it yourself
- The pH of a seawater sample falls from 8.0 to 7.9. By what factor does the H⁺ concentration rise?
- If the pH fell from 8.1 to 7.8, by what factor would the H⁺ concentration rise?
- If human activities released 11 PgC of carbon in a year and it was shared out in the same proportions as the IPCC’s 2010–2019 figures, how many PgC would the ocean take up?
Answers: 1) By . 2) By . 3) PgC.
In short
- Carbon is found in rocks, the ocean, the atmosphere, living things, soil and fossil fuels; rocks are the largest store.
- The fast cycle runs through living things by photosynthesis and respiration; CO₂ in the air “breathes” with the seasons.
- The slow cycle takes 100–200 million years, through rock weathering, limestone formation and volcanoes.
- At Mauna Loa, CO₂ rose by about 35% from 1959 to 2025.
- In 2010–2019, 46% of human CO₂ stayed in the atmosphere, the ocean took up 23% and land 31%.
- CO₂ dissolving in the ocean lowers pH and reduces carbonate ions; a pH drop of 0.1 is an increase of about 26% in H⁺.
You can read about a plant that stores carbon under the sea in What is Posidonia seagrass?, about the soil that stores it on land in What is soil carbon?, and about why CO₂ warms the planet in What is the greenhouse effect? Study where the cycle begins in our lesson Photosynthesis and light, and try it yourself by changing carbon dioxide and light in the Lab figure The leaf factory.
Frequently asked
4 questionsWhat is the carbon cycle?
It is the movement of carbon between the atmosphere, living things, soil, the ocean and rocks. The fast cycle runs on the timescale of living things through photosynthesis and respiration; the slow cycle takes 100–200 million years, through rock weathering, limestone formation and volcanoes.
What is ocean acidification?
It is the way CO₂ from the air dissolves in seawater, forms carbonic acid and lowers the water's pH. At the same time carbonate ions decrease; carbonate is the building block that shell-building organisms use to make calcium carbonate. The ocean is still slightly basic; acidification describes the direction in which pH is falling.
How much has ocean pH fallen?
According to NASA, the pH of the ocean surface has fallen by about 0.1 units since 1750. Because pH is logarithmic, that means the hydrogen ion concentration has risen by a factor of about 1.26. According to the IPCC, in subtropical surface waters pH has been falling by 0.016–0.020 units per decade since the 1980s.
How much human CO₂ goes into the ocean?
According to the IPCC Sixth Assessment Report, in 2010–2019 the ocean took up about 23% of human CO₂ emissions and vegetation on land about 31%; 46% stayed in the atmosphere.
Sources
7 sources- 1.COP31 Türkiye: Thematic days announced (opens in a new tab)
- 2.NASA Earth Observatory: The Carbon Cycle (Riebeek, 2011) (opens in a new tab)
- 3.NOAA Global Monitoring Laboratory: Trends in Atmospheric Carbon Dioxide (Mauna Loa) (opens in a new tab)
- 4.NOAA GML: Mauna Loa CO₂ annual and monthly mean data files (co2_annmean_mlo.txt, co2_mm_mlo.txt) (opens in a new tab)
- 5.IPCC (2021). AR6 WG1, Chapter 5: Global Carbon and Other Biogeochemical Cycles and Feedbacks (Executive Summary) (opens in a new tab)
- 6.IPCC (2021). AR6 WG1, Summary for Policymakers (A.1.1, A.2) (opens in a new tab)
- 7.NOAA PMEL Carbon Program: Ocean Acidification (opens in a new tab)
- #carbon cycle
- #ocean acidification
- #pH
- #Mauna Loa
- #photosynthesis
- #COP31