How is Earth's temperature measured? Stations, floats, satellites and anomalies
No single thermometer measures Earth's average temperature. We explain how data from land stations, ships, Argo floats and satellites are combined, why scientists use anomalies instead of absolute temperatures, and what the four major datasets are.
In this article · 7 sections
The theme of COP31’s 16 November is Science, Industry and Technology (COP31 thematic days). Everything said about climate starts with a measurement. This article explains how perhaps the most quoted climate number of all is measured: the change in Earth’s average temperature.
When you read a sentence like “last year Earth was 1.43 °C warmer than pre-industrial times”, you might wonder: who measured Earth’s temperature, and with what thermometer? The answer is not one thermometer but the careful combination of a great many measurements from all over the world. And the key idea behind combining them is a surprisingly simple subtraction.
Four eyes: land, sea, depth and space
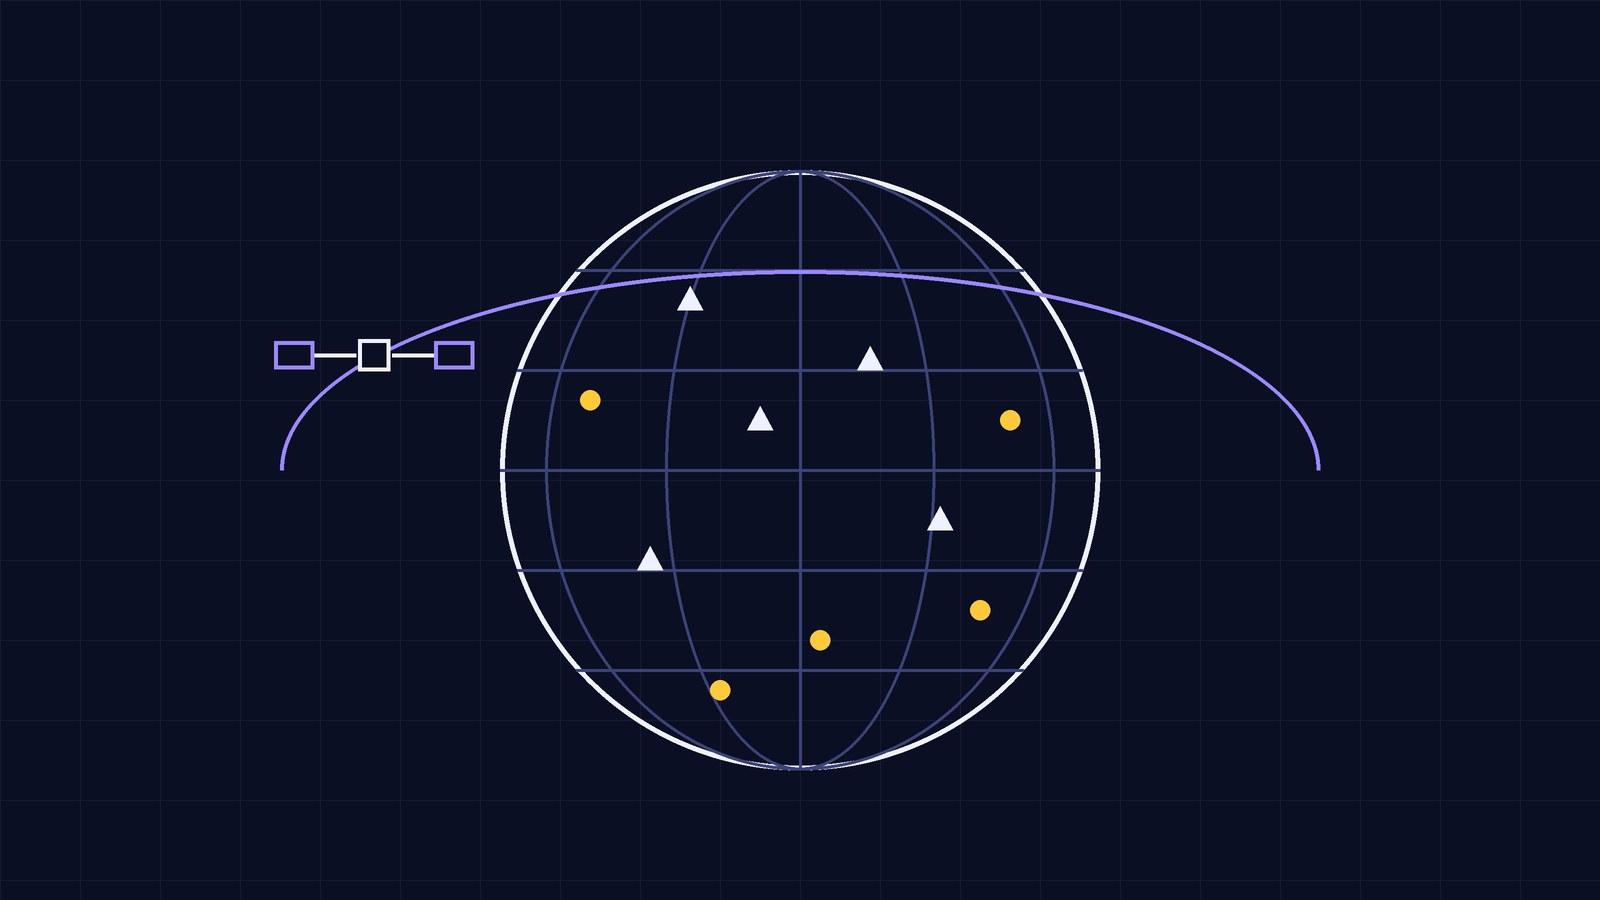
1. Land stations. Weather stations around the world measure air temperature every day. Thermometers sit in white boxes that give shade but let air through, at a set height above the ground; at UK Met Office stations that height is 1.25 m. (Our article How do you measure weather and climate at home? explains the reasons for these rules.) The measurements are collected from national services; the monthly dataset called GHCNm from the US National Oceanic and Atmospheric Administration (NOAA) is the land source for many global analyses.
2. The sea surface. Most of Earth’s surface is ocean. Sea surface temperature has been measured from ships for many years, and later from moored and drifting buoys. These records are gathered in international archives such as ICOADS and turned into sea surface temperature datasets such as NOAA’s ERSST and the Met Office’s HadSST.
3. Inside the ocean: Argo. The floats of the Argo programme are small robots that dive into the sea. The programme began in 2000 and today close to 4,000 active floats are at work. Argo describes the cycle like this: a float drifts at about 1,000 m for about 9 days, then sinks to 2,000 m and measures temperature, salinity and pressure as it rises to the surface. At the surface it sends its data to a satellite and starts the 10-day cycle again. Its sensors measure temperature to an accuracy of 0.001 °C. In July 2024 the programme collected its three millionth profile.
4. Satellites and reanalysis. Satellites scan the land, sea and atmosphere from above with infrared and microwave sensors. These data are used together with other measurements in a method called reanalysis: a weather forecasting model “digests” all past observations in turn to build a consistent picture of the atmosphere. ERA5, produced by ECMWF for Europe’s Copernicus programme, provides hourly values from 1940 to the present.
Why anomalies, not absolute temperatures?
Say there are two stations. One is on a mountain, with a long-term average of 5 °C; the other is in a valley, with an average of 15 °C. One year, both are measured 1 °C above their averages: mountain 6 °C, valley 16 °C.
- Absolute average: °C.
- The next year the mountain station breaks down and only the valley reports: 16 °C. The absolute average seems to have “risen” from 11 to 16. Yet the weather has not changed at all; what changed is which station was measuring.
Now subtract each station’s own long-term average from its measurement. This difference is called the temperature anomaly:
- First year: mountain , valley ; average anomaly .
- Next year, valley only: ; average anomaly still .
The anomaly removes differences that come from a station’s height or location. As NASA’s GISTEMP team explains, finding the absolute average temperature of a region carries large uncertainties, which is why analyses work with anomalies instead of absolute temperatures. Also, the trend does not depend on the chosen reference period: if a place is 2 degrees warmer than a year ago, its anomaly is also 2 degrees higher.
Anomalies have another advantage: even when nearby places have different temperatures, their temperature changes move together. A 1987 study by Hansen and Lebedeff showed that at middle and high latitudes, temperature changes at stations less than 1,000 km apart are highly correlated. This makes it possible to estimate the change in sparsely covered regions from their neighbours.
For the same reason, months are compared using anomalies. As GISTEMP explains, global average temperature has a seasonal cycle; July and August are on average about 3.6 °C warmer than December and January. An August being warmer than a February tells us nothing on its own.
Let’s calculate: an area-weighted average
It is not enough to add up all the anomalies and divide by the number of stations, because stations are not spread evenly across the world. Analyses first divide the world into grid boxes (for example 5° by 5° boxes in HadCRUT5), find each box’s average anomaly, then weight the boxes by their area.
Latitude–longitude boxes get smaller towards the poles. The area of a box of a given width is roughly proportional to the cosine of its latitude:
- At the equator ():
- At latitude:
Example (the values are chosen to show the calculation): say a box at the equator has an anomaly of +0.8 °C and a box at 60° latitude has +2.0 °C.
- Simple average: °C.
- Area-weighted average: °C.
The smaller box has less influence on the result. Real analyses do this with thousands of boxes and also take account of missing data, changes in measurement methods and local effects such as the urban heat island.
The four major datasets
| Dataset | Produced by | Source data | Reference period |
|---|---|---|---|
| GISTEMP | NASA Goddard Institute for Space Studies | GHCN v4 (land), ERSST v5 (sea) | 1951–1980 |
| NOAAGlobalTemp | NOAA National Centers for Environmental Information | GHCNm v4, ERSST v6, ICOADS | 1991–2020 |
| HadCRUT5 | Met Office Hadley Centre and the Climatic Research Unit, University of East Anglia | CRUTEM5 (land), HadSST4 (sea) | 1961–1990 |
| ERA5 | ECMWF, Copernicus Climate Change Service | Reanalysis: observations and a weather model | (anomalies are given against various periods) |
Because the reference periods differ, the anomaly for the same year looks like a different number in each dataset. This is not a contradiction: it is the same change measured from different “zero points”. To compare them, they are all moved to a common period. The World Meteorological Organization (WMO) reports global temperature relative to the 1850–1900 average, which it uses as an approximation of pre-industrial levels.
Changing the reference period: to move a dataset’s anomalies to a new period, find the average of the old anomalies over the new period and subtract it from every value. For example (example values), if a year’s anomaly is +0.9 °C against the old period, and the new period averages +0.3 °C in old anomalies, the year’s anomaly against the new period is °C. The slope of the trend does not change; only the zero point shifts.
The latest figure: what does WMO say?
According to WMO’s State of the Global Climate 2025 report, published on 23 March 2026:
- In 2025, the global mean near-surface temperature was about 1.43 ± 0.13 °C above the 1850–1900 average. That makes it the second or third warmest year in the 176-year observational record, depending on the dataset. According to WMO’s State of the Climate Update 2026, published on 9 November 2026, the January–September 2026 average was about 1.47 ± 0.13 °C above 1850–1900; as the year is not yet over, this is not a final annual value.
- The warmest year is still 2024, at about 1.55 °C.
- The eleven years from 2015 to 2025 are the eleven warmest on record.
- In 2025, ocean heat content down to 2,000 m reached its highest level since records began in 1960.
What does “± 0.13” mean? The report’s estimate is not a single number but a range: from to °C. The datasets’ methods and regions not covered by measurements contribute to this uncertainty. This is also why the same year can rank second in one dataset and third in another: the difference between years can be smaller than the uncertainty.
Common mix-ups
“An anomaly is the temperature of a place.” An anomaly is not a temperature but a difference: how far the measured value departs from the long-term average. An anomaly of +1 °C does not mean the air is at 1 °C.
“The global average is a simple average of all the stations.” Analyses first combine anomalies in grid boxes, then weight the boxes by area. The ocean is included too.
“If the datasets give different numbers, they contradict each other.” Most of the differences come from different reference periods. Moved to a common period, the datasets show a similar change; the small differences that remain lie within method differences and the uncertainty range.
“Satellites can’t measure without a thermometer on the ground.” Satellites measure the radiation given off by the surface and atmosphere; these measurements are converted to temperature using the laws of physics and checked against measurements on the ground.
In short
- Global temperature is calculated by combining data from land stations, ships, buoys, Argo and satellites.
- An anomaly is the difference between a measured value and that place’s long-term average; it removes the effect of location and height.
- The global average is an area-weighted average of grid boxes.
- GISTEMP, NOAAGlobalTemp, HadCRUT5 and ERA5 use different reference periods; moved to a common period, they show a similar change.
- According to WMO, 2025 was about 1.43 ± 0.13 °C above the 1850–1900 average; the warmest year is 2024.
You can study averages in our lesson Reading data: mean, median and mode and the difference between temperature and heat in our lesson Heat and temperature. In the Lab figure Same heat, different temperature, try how much the same energy warms different materials; it helps you understand why the ocean warms slowly. You can find the physics of the measured warming in What is the greenhouse effect?
Frequently asked
4 questionsHow is Earth's average temperature measured?
Air temperatures from land stations and sea surface temperatures measured from ships and buoys are combined. The long-term average for each place is subtracted from each measurement to find the anomaly; the anomalies are combined in grid boxes and weighted by area to calculate the global average.
What is a temperature anomaly?
It is the difference between a measured temperature and the long-term average for that place and period. Because an anomaly removes differences due to a station's height and location, it is more reliable than absolute temperature for tracking global change.
What is an Argo float?
It is a robotic instrument that dives into the ocean and comes back up. It drifts at about 1,000 m for around 9 days, sinks to 2,000 m, measures temperature and salinity as it rises, and sends its data to a satellite at the surface. The programme began in 2000; today there are close to 4,000 active floats.
How warm was 2025?
According to WMO's State of the Global Climate 2025 report, the global mean near-surface temperature in 2025 was about 1.43 ± 0.13 °C above the 1850–1900 average. That makes it the second or third warmest year depending on the dataset; the warmest year is 2024, at about 1.55 °C.
Sources
13 sources- 1.COP31 Türkiye: Thematic days announced (opens in a new tab)
- 2.WMO: State of the Global Climate 2025 (23 March 2026) (opens in a new tab)
- 3.WMO press release: Earth's climate swings increasingly out of balance (23 March 2026) (opens in a new tab)
- 4.WMO: State of the Climate Update for COP31 (9 November 2026) (opens in a new tab)
- 5.WMO press release: State of the climate in 2026 gives new meaning to phrase “off the charts” (9 November 2026) (opens in a new tab)
- 6.NASA GISS: GISTEMP Frequently Asked Questions (opens in a new tab)
- 7.NASA GISS: GISS Surface Temperature Analysis (GISTEMP v4) (opens in a new tab)
- 8.NOAA NCEI: NOAA Global Surface Temperature (NOAAGlobalTemp) (opens in a new tab)
- 9.Met Office Hadley Centre: HadCRUT5 (opens in a new tab)
- 10.Copernicus Climate Change Service: Climate reanalysis (ERA5) (opens in a new tab)
- 11.Argo: How do floats work? and Argo's status (opens in a new tab)
- 12.Met Office: How we measure temperature (opens in a new tab)
- 13.Hansen and Lebedeff (1987). Global trends of measured surface air temperature. Journal of Geophysical Research 92, 13345–13372 (opens in a new tab)
- #global temperature
- #anomaly
- #Argo
- #weather station
- #dataset
- #COP31