How do you measure weather and climate at home? With your own rain gauge and thermometer
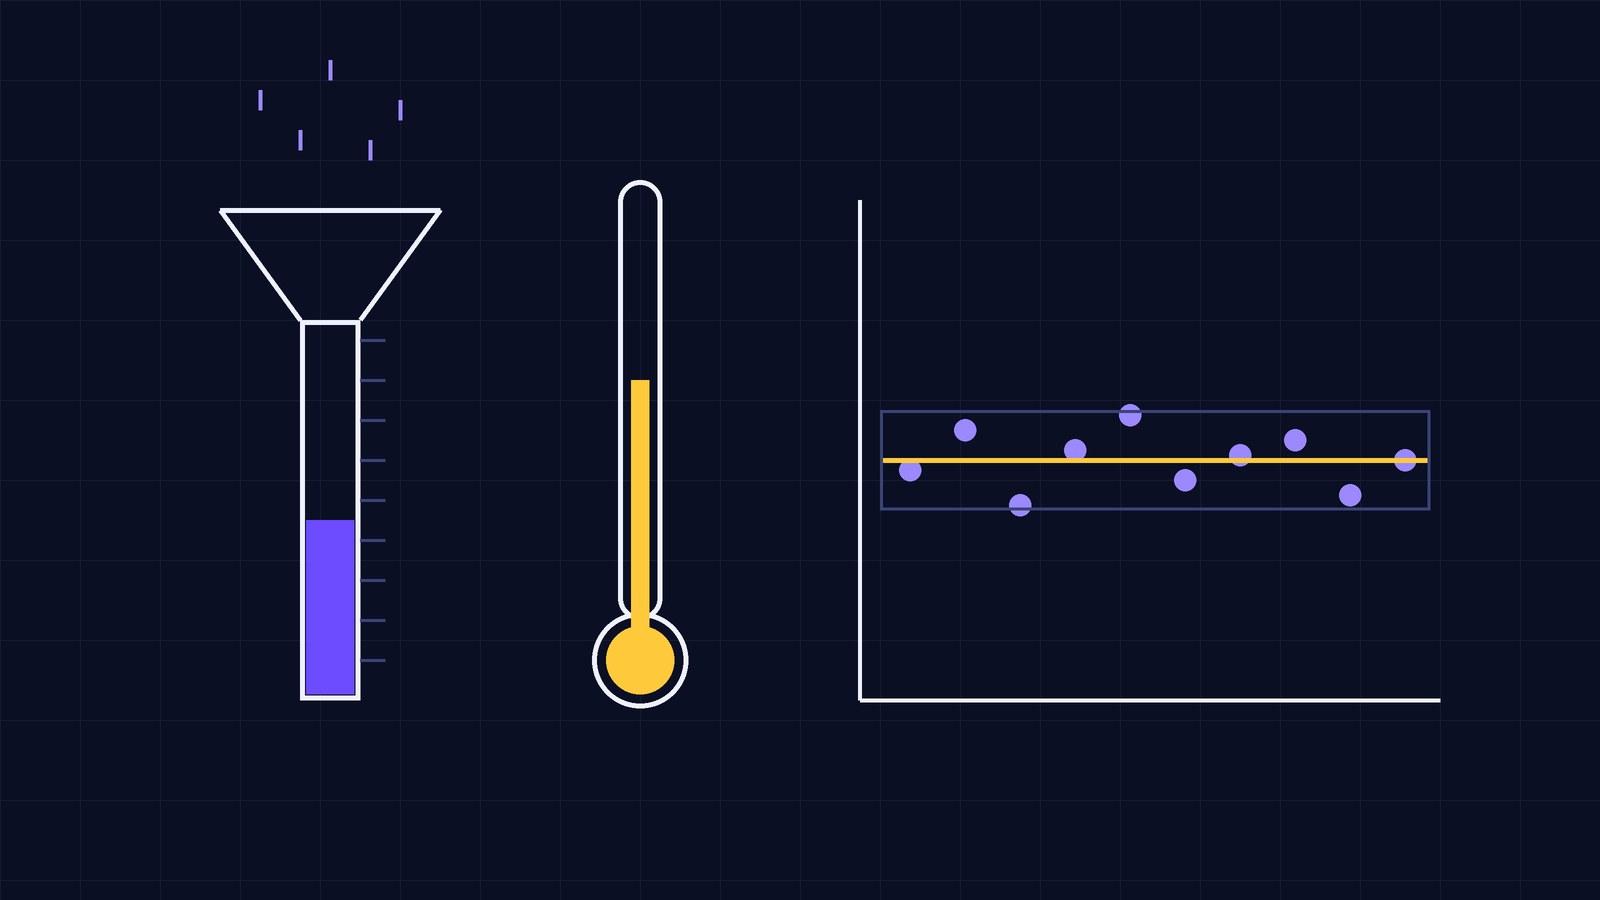
With a jar, a funnel and a thermometer you can keep your own weather records. We explain what a millimetre of rain means, why the funnel enters the calculation, why the thermometer must be in the shade, and how to work out the average and uncertainty of your measurements.
In this article · 9 sections
The theme of COP31’s 14 November is Children, Youth, Education and Skills (COP31 thematic days). The basic skill of climate science is measuring. In this article we explain how to measure rain and temperature at home, and how far you can trust the numbers you get.
On the weather forecast you hear a sentence like “12 mm of rain fell yesterday”. But 12 millimetres of what? Or when someone says “it’s 31 degrees today”, where and how was that number measured? The essence of what weather stations do can be done at home with simple tools too. The difference is that stations make every measurement by the same rules.
What does a millimetre of rain mean?
Rainfall is measured as the height of water that would collect on a flat, waterproof surface. 1 mm of rain means that the water falling on the ground would form a layer 1 mm deep if it did not run away.
Let’s turn this into a volume. The volume of water 1 mm (0.001 m) deep over an area of 1 m² is:
So 1 mm of rain means 1 litre of water on every square metre. A 100 m² roof that gets 12 mm of rain has received litres of water.
Make your own rain gauge
The simplest rain gauge is a straight-sided container whose opening and base are the same width. You just measure the height of the water inside with a ruler. But in light rain the water is only a few millimetres deep and hard to read with a ruler. That is why most gauges use a funnel: water collected through a wide opening rises higher in a narrow tube.
Example: say the funnel’s opening is 20 cm across and the tube below it is 5 cm across inside. Areas are proportional to the square of the diameter:
Water falling into the funnel is gathered into an area 16 times smaller. So 16 mm of water in the tube corresponds to 1 mm of rain. If you see 40 mm of water in the tube, the rainfall is mm. Reading has become 16 times easier.
No tube? Pour the water you collected into a kitchen measuring jug and read the volume in millilitres. Since 1 mL = 1 cm³, the rainfall depth is:
A funnel 20 cm across has an opening area of cm². If you collected 157 mL, the rainfall is mm.
The gauges used by the UK Met Office rely on the same idea. The automatic tipping-bucket gauge has a funnel with a 750 cm² collecting area, its rim is 450 mm above the ground, and it records an event for every 0.2 mm of rain. The classic manually read gauge has a sharp rim 127 mm across, sits 30 cm above the ground and is read every morning at 09:00 UTC.
Placement tips:
- Put the gauge in an open spot away from roofs, walls and trees. Obstacles block some of the rain or drip extra water into it.
- Keep its opening level and stop it blowing over; weigh the base down with stones.
- Read it at the same time every day and empty it. That way each number covers the same length of time.
- In hot weather water evaporates; a gauge left unread for a long time shows less rain.
Temperature: why in the shade?
If you put a thermometer in direct sunlight, it warms up not only from the air but also by absorbing sunlight. The value it shows is no longer the temperature of the air but the temperature of the thermometer itself. (In our article What is an urban heat island? we saw that a surface in the sun can be tens of degrees warmer than the air.)
That is why weather stations keep the thermometer in a box that is shaded but ventilated. At Met Office stations the thermometer sits inside a white box with louvred sides (a Stevenson screen) 1.25 m above the ground, and the air reaches it through natural ventilation. The white colour reflects sunlight, and the louvres give shade while letting air through.
To do something similar at home, you can hang the thermometer in the shade of a north-facing wall (one that gets no sun in the Northern Hemisphere), not touching the wall, about 1–1.5 m above the ground.
A small experiment: put one of two identical thermometers in the sun and the other in the shade, and read both after 20 minutes. The difference does not mean “the air is warmer in the sun”; most of it comes from the thermometer in the sun absorbing light.
How reliable is a measurement?
Every measurement has an uncertainty. It has several sources:
- Reading resolution: on a thermometer marked every 1 °C, it is hard to tell 21.5 from 21.4.
- The person reading: if your eye is not level with the mark, the reading shifts slightly.
- The instrument: two thermometers can show different values in the same air. That is why stations regularly check their instruments against a known reference.
One way to reduce uncertainty is to measure again. Example (the values are chosen to show the calculation): seven people read the same thermometer at the same moment and write down these values:
21.4 · 21.8 · 21.6 · 22.0 · 21.5 · 21.7 · 21.9 °C
Average (mean):
Spread: each value differs from the mean by −0.3, 0.1, −0.1, 0.3, −0.2, 0 and 0.2. The sum of the squares of these differences is 0.28. The standard deviation is:
This tells you how far a single reading typically strays from the mean. The mean itself is more reliable than a single reading. Its uncertainty is estimated by dividing the standard deviation by the square root of the number of measurements:
You can write the result as 21.7 ± 0.1 °C. If you take four times as many measurements, this uncertainty halves, because . This method reduces differences that scatter randomly; it does not reduce a systematic difference, such as a thermometer that always reads high.
Daily average and climate
The weather changes every hour. There are two common ways to describe a day’s temperature with one number:
- The average of the day’s highest and lowest temperatures. If the high is 30 °C and the low is 18 °C, that is °C.
- The average of 24 measurements taken every hour through the day.
The two methods usually give results that are close but not identical. So when comparing records, you need to know which method was used.
A day’s conditions are weather; the average over many years is climate. The World Meteorological Organization (WMO) recommends calculating climate averages (“normals”) over 30-year periods and updating the period every decade; the current standard period is 1991–2020. For tracking long-term climate change, it recommends continuing to use 1961–1990 as a fixed reference period.
Citizen science: where measurements meet
Measurements by volunteers can be part of a scientific network. In the United States, CoCoRaHS (the Community Collaborative Rain, Hail and Snow Network) began in 1998 at the Colorado Climate Center, following the Fort Collins flood a year earlier, and has since brought together thousands of volunteers. The volunteers read the same type of gauge by the same rules, so numbers from thousands of points can be put together.
The key idea here is the standard. Your gauge may be simpler than a station’s, but if you measure at the same time, in the same place, by the same method every day, your own record can be compared with itself.
Try it at home: a two-week weather diary
You will need: a jar whose opening and base are the same width, or a funnel and a clear bottle; a ruler or measuring jug; a thermometer; a notebook.
- Put your rain gauge in an open spot and your thermometer in ventilated shade.
- For two weeks, read the rainfall and temperature at the same time each day; empty the container.
- On a rainy day, have two people read the same gauge separately; note the difference.
- At the end of each week, work out the mean and standard deviation of the daily temperatures, and add up the rainfall.
- Plot your results on a chart and compare them with values from a nearby weather station for the same days.
Predict: will your gauge show more or less rain than the station? Why?
Safety note: if you use a glass thermometer, take care not to break it. Ask an adult for help when hanging it up high.
Common mix-ups
“A thermometer in the sun shows the real temperature.” A thermometer in the sun absorbs light, so it ends up warmer than the air. Air temperature is measured in a shaded, ventilated spot.
“More measurements always give a more accurate result.” Repeating a measurement reduces random differences, but it does not remove a systematic bias in the instrument. For that, you need to compare the instrument with a known value.
“One cold day shows the climate is cooling.” A single day is weather. Climate is described by averages over long periods, such as 30 years.
In short
- 1 mm of rain means 1 litre of water on every square metre.
- A funnel makes reading easier by gathering water into a narrow area; the multiplier is the ratio of the areas.
- Air temperature is measured in a shaded, ventilated spot; at stations the thermometer is about 1.25 m above the ground.
- An average is more reliable than a single reading; its uncertainty is about .
- Climate normals are 30-year averages; the current standard period is 1991–2020.
You can study mean and spread in our lesson Reading data: mean, median and mode and in the article Mean, median and mode, and why many trials settle towards a stable result in our lesson Law of large numbers. In the Lab figure Experimental probability, see for yourself how the result steadies as you increase the number of trials. You can find the physics behind the temperature you measure in What is the greenhouse effect?
Frequently asked
4 questionsHow much water is 1 mm of rain?
1 mm of rain means 1 litre of water has fallen on every square metre. An area of 1 m² times a height of 0.001 m is 0.001 m³, or 1 litre.
How do you make a rain gauge at home?
Put a container whose opening and base are the same width in an open spot and measure the height of the water inside with a ruler. If you use a funnel, divide the volume of water collected (mL) by the area of the funnel opening (cm²) and multiply by 10 to get the rainfall in millimetres.
Why is a thermometer put in the shade?
A thermometer in the sun warms up by absorbing light and shows a higher value than the air. At weather stations the thermometer sits about 1.25 m above the ground in a white box that gives shade but lets air through.
How do you work out measurement uncertainty?
Measure the same quantity several times and work out the mean and standard deviation. The uncertainty of the mean is roughly the standard deviation divided by the square root of the number of measurements. This reduces random differences but does not remove an instrument's systematic bias.
Sources
5 sources- 1.COP31 Türkiye: Thematic days announced (opens in a new tab)
- 2.Met Office: How we measure rainfall (opens in a new tab)
- 3.Met Office: How we measure temperature (opens in a new tab)
- 4.WMO: Updated 30-year reference period reflects changing climate (5 May 2021) (opens in a new tab)
- 5.CoCoRaHS: About Us (opens in a new tab)
- #rain gauge
- #temperature measurement
- #average
- #measurement uncertainty
- #citizen science
- #COP31